How would Proportional Representation impact your region?
Guest blog by Peter Cheng and Debbie Wouldman from MVM Worthing who have produced an easy guide to estimating the result.
We know the First Past the Post (FPTP) voting system produces unfair Parliamentary election results. People may accept that the electoral system could be fairer, but it can be harder to persuade them to support something different, like Proportional Representation (PR), if you only use abstract and general arguments. Concrete figures of how much FPTP distorts elections in your particular region is a useful tool for promoting the PR message. In just a few easy steps, you can estimate what the results of PR would be like in your region.
Take the last General Election in 2019 and how it would likely have turned out under a Mixed Member Proportional System (MMPS), also known as the Additional Member system. In MMPS, a number of constituencies are grouped together into a super-constituency. In each constituency FPTP is used to elect an MP. Then, all the votes across the super-constituency are used to select extra MPs so that the overall proportion of MPs reflects the proportion of votes. Here’s a video on how MMPS works if you want more details.
Your calculation will be approximate, because we only have votes cast for individual candidates and no information on party preference, or the use of tactical voting. Despite these provisos, the outcomes are usually clear and striking, so we think they do give a good sense of how things would change under PR.
For our example, because we are members of MVM Worthing, we’ve picked Worthing’s two constituencies and three neighbouring ones, which could (one day) form a West Sussex super-constituency. Here’s how it works:
Step 1: Pick four neighbouring constituencies in your area as well as your own
Make a note of their names from this website that identifies all constituencies in the UK.
Step 2: Look up the results from the last General Election
For each of your five selected constituencies look up their results using this website.
Here is the data for Worthing West as an example:

NB: The website has options for the download of all data as a spreadsheet.
Step 3: Collate the data
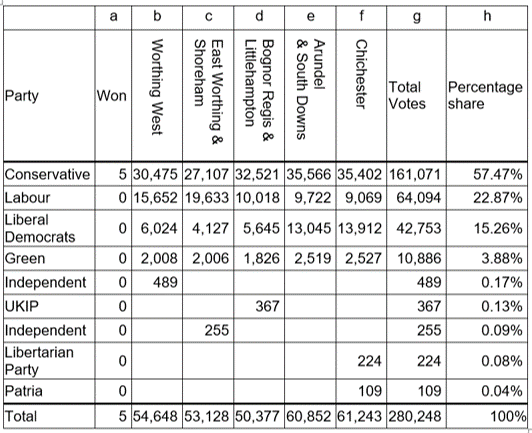
You can make a table with rows for all the parties and five columns for your constituencies. Tally up the number of seats won by each party and put it under “won” (column a). Add the number of votes for each party in each constituency (bottom row, columns b-f). Add up the grand total of votes per party across all 5 constituencies (column g). Then calculate the total number of votes (bottom row, column g). So, in this example it is 280,248. Use this value to calculate the percentage share of each party (column h) by dividing the total votes by the grand total then multiplying by 100 to work out the percentage.
Here’s our table:
Step 4: Select eligible parties
In MMPS candidates who receive very small numbers of votes get set aside at the first stage of calculation. Here we choose 1%, which means according to the percentage share (column h), the bottom five parties are dropped and only the Conservatives, Labour, Liberal Democrats and Greens are considered in the next steps.
Step 5: Calculate share of seats
Let’s assume that the super-constituency will have ten seats in total; the following table illustrates how to calculate the distribution of seats. The number of seats won by candidates and votes received by each party are listed again (in columns a and b). The new grant total of votes is slightly reduced, 278,804, because the candidates with very low counts were eliminated. Convert the percentage of votes into the share of seats by dividing by 10 (column d). The seats allocated to each party to give them a proportional share is shown in the top-up seats column (e).

Step 6: Allocate top-up seats
Top-up seats are allocated to bring the share of seats as close to the share of votes as possible. This step considers the whole number parts of seats in the proportional share of seats (column d), ignoring anything after the decimal point for now. As the Conservatives won five constituency seats they got five seats. Labour needs two top-up seats for its proportional share as they didn’t win any constituency seats. The Liberal Democrats are allocated one seat for similar reasons. The Green’s have no whole seats in the proportional share as it is less than one, so they are not allocated a seat in this round.
Three of the five top-up seats have been allocated, so there are two more to make up the total of 10. In the second step, we consider the proportion of seats after the decimal points for each party. Who has the greatest fraction? The Conservatives have 0.78, so they are allocated one of the seats. Next are the Liberal Democrats with 0.53, so they receive the remaining seat. Unfortunately for the Greens, their fractional share is just too small. To get the total number of seats you add the constituency and top-up seats (columns a and e).
Step 7: Compare FPTP and PR results
This is your reward for completing the above steps. Across the five constituencies under FPTP, the Conservatives won all - 100% - of the seats. But their share of the votes was only about 60%.Our calculation under MMPS would have given them 60% of the seats and Labour and the Liberal Democrats would have each received 20% of the seats on 24% and 16% vote shares, respectively.
It is quite possible that the Greens would have won a seat in a real election with this system because many voters could have picked their preferred choice of the Green Party rather than voting tactically in an attempt to have an MP on their end of the political spectrum.
Why not try estimating the result in your region? You could test different selections of constituencies. Or, if you are very keen, you could imagine being the Electoral Commission and try modelling the whole of the UK. We would love to hear about your results!
Let us know how you get on at local@makevotesmatter.org.uk
Notes:
1. A standard implementation of the MMPS gives voters two choices, one for a specific candidate and one for a party. We cannot know what these choices would have been in the past, so we have had to assume that both choices are the same as their single choice in 2019.
2. To keep the calculation simple we have picked five constituencies to make one super-constituency, and assumed five top-up seats. A real life implementation of MMPS might pair up existing constituencies, each with one MP, to form a super constituency from five of those pairs. This would not increase the total number of MPs.